One of the prices online retailers are paying for the increased use of mobile devices to browse their stores is a marked reduction in conversion rate. In most cases mobile conversion rate is roughly half that of desktop.
How bad or good is my mobile conversion rate?
A nightmare scenario is one in which nothing can be done about this – but the good news is that, by identifying where you stand, you can address the problem and by removing friction from the mobile experience.
At Biglight we have developed a benchmarking tool – the Biglight Benchmark – to help do just that It’s a neat, simple way to size your mobile conversion rate problem, and secure the budget required to tackle it.
How to benchmark your mobile conversion
You’ll first need some data and a calculator then:
1. Calculate your mobile traffic mix:
Mobile Traffic divided by total traffic multiplied by 100
2. Calculate mobile conversion rate as a percentage of desktop conversion rate (Relative conversion rate)
Mobile conversion rate divided by desktop conversion rate, multiplied by 100.
3. Plot your position on the quadrant below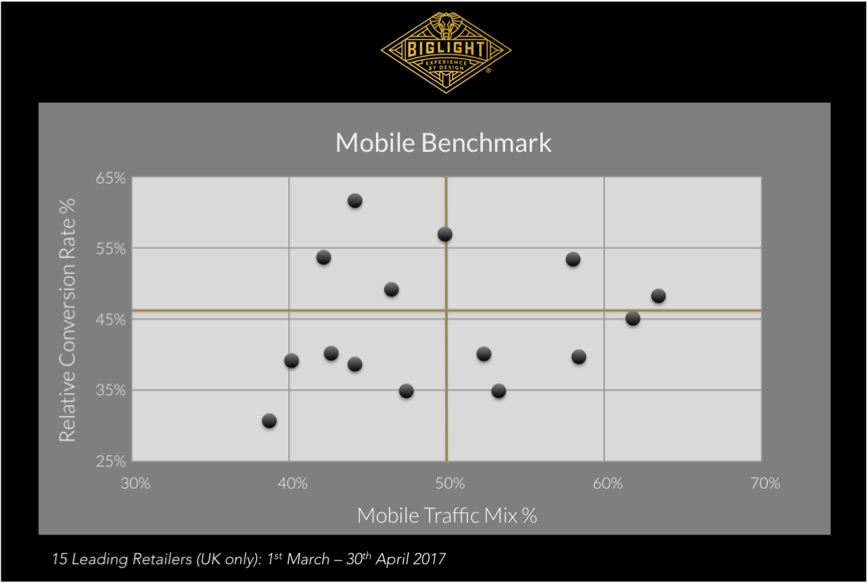
The two gold lines represent the weighted average positions on each axis – 50% for the mobile traffic mix, and just over 45% for mobile conversion rate, as a percentage of desktop conversion rate.
This is real data, based on the UK performance of 15 leading retailers of apparel, footwear, homewares and accessories in March and April this year, but the method can be applied to almost any type of retailer.
What does the mobile benchmark tell us?
This is where you uncover the opportunity: a retailer in the top left is in a relatively strong position, mobile users are a lower proportion of the mix but convert well relative to desktop.
Those in the bottom right have a big opportunity – lots of mobile traffic is converting poorly, so some targeted optimisation can deliver rapid returns .
Whilst these are two extremes, opportunities exist for the majority of retailers.
What can I do about it?
The first job is to break the user journey down into stages. Look at ‘Browse to Basket’ and ‘Basket to Conversion’ as two broad steps in the journey – then in more detail at micro-conversions (for instance the product detail page to product listing page micro-conversion), to identify the specific parts of the journey that present the biggest optimisation opportunities.
You can then carry out structured usability testing, focusing on priority elements of the journey – along with other behavioural research to identify the why behind the opportunities the data has revealed. That discipline, along with prototyping major changes, A/B testing and rapid deployment, are the final steps towards delivering a step-change in mobile revenue performance.
I’ll cover those steps in the process in more detail in my next post. In the meantime, why not benchmark your mobile conversion performance and see how you compare?
For more information on how to increase your mobile conversion rate, speak to one of our team.